In this article, I will show how to build a clock using p5.js, step by step. Here is what the final result looks like:
Step 1: Create a square canvas with an origin point
When you create a new p5.js sketch in the Processing IDE, you start with empty setup() and draw() functions. For example:
function setup() {

}

function draw() {

}
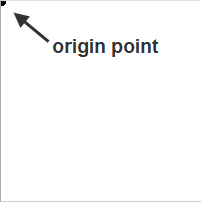
So the first thing we want to do is create a square canvas with a white background and draw an origin point at (0,0):
function setup() {
  createCanvas(200, 200);
  background(255);
}

function draw() {
  strokeWeight(10);
  point(0,0);
}
By default, the origin point of the Processing Cartesian coordinate system is in the upper left corner of the screen:
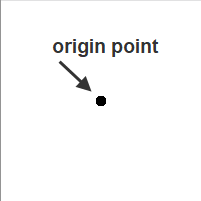
Step 2: Move the origin point to the center of the screen
In order to have a circular clock in the middle of the screen, we need to move the origin point to the center. This can be done using the translate() function. For example:
translate(width/2, height/2);
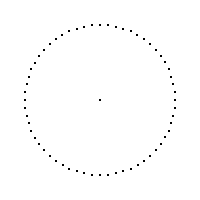
Step 3: Display tick marks
Since a clock is made up of 60 minutes, and each minute contains 60 seconds, we need to create a circle and divide it into 60 sections. Each section will be denoted as a point or “tick mark”.
We will need to set up some variables to describe this circle, including the radius of the circle and the number of tick marks we want to divide the circle into. The angles are calculated by taking the whole circle “TWO_PI”, and dividing it by the number of tick marks.
var radius = 75.0;
var numPoints = 60;
var angle = TWO_PI/numPoints;
Then we want to change the strokeWeight again so the points are smaller and then use a feature called beginShape(), where point vertices are added together to form a unified shape. A while loop can be used to create the tick marks in the shape. For example, inside the draw() function:
//Draw the minute/second ticks
// beginShape() will build the points into a single custom shape
strokeWeight(2);
stroke(255);
beginShape(POINTS);
var i = 0;
while (i < numPoints ) {
  x = cos(angle*i) * secondsRadius;
  y = sin(angle*i) * secondsRadius;
  vertex(x, y);
  i++;
}
endShape();
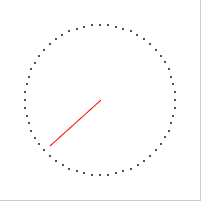
Step 4: Create a second hand
To create the second hand, we need to set up a new variable and we want the line to be shorter than the radius.
var secondsRadius = radius * 0.9;
To keep track of seconds, we need a new variable (called ‘s’ in this case) that uses the built in functions second() and map(). We also want to subtract HALF_PI so that the seconds start at the top of the clock (12 o’clock position):
// subtract HALF_PI to make them start at the top
var s = map(second(), 0, 60, 0, TWO_PI) - HALF_PI;
Next, we need to add the actual line that represents the seconds hand. In this code, I gave it a line weight of 1 and made it red. Notice that this uses the sin() and cos() functions.
strokeWeight(1);
stroke('red');
line(0, 0, cos(s) * secondsRadius, sin(s) * secondsRadius);
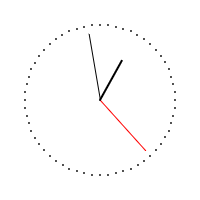
At this point, the seconds hand will appear as a red line that moves around the clock face.
Important: In order to “clear” the background every time the second hand moves, we must set the background to white inside the draw function loop:
// Drawing the background inside the draw function is necessary
// to refresh the background so that the hands appear to move
// on the clock and the previous hands disappear.
background(255);
Step 5: Create minute and hour hands
The minute and hour hands are created in much the same way as the second hand. For example, add the following lines to the draw() function:
var m = map(minute() + norm(second(), 0, 60), 0, 60, 0, TWO_PI) - HALF_PI;
var h = map(hour() + norm(minute(), 0, 60), 0, 24, 0, TWO_PI * 2) - HALF_PI;

strokeWeight(1);
stroke('red');
line(0, 0, cos(s) * secondsRadius, sin(s) * secondsRadius);
stroke(0);   // change line color to black
line(0, 0, cos(m) * minutesRadius, sin(m) * minutesRadius);
strokeWeight(2);  // hour hand should be thicker
line(0, 0, cos(h) * hoursRadius, sin(h) * hoursRadius);
For minutes and hours, we are also using the functions minute(), hour(), and norm().
Step 6: Add numerals and colors
The final step is to change the size, add colors, add numerals, and complete the overall look of the clock. Lots of experimentation can occur in this stage to get the clock to look just the way you want.
Change the size of the clock to 450 x 450.
createCanvas(450, 450);
Set the radius to be the size of the window.
var radius = int(min(width, height) / 2);
Adjust the length of the hands and add a clockDiameter variable.
var secondsRadius = radius * 0.72;
var minutesRadius = radius * 0.60;
var hoursRadius = radius * 0.50;
var clockDiameter = radius * 1.8;
Draw the clock background and fill with gray.
// Draw the clock background
fill(80);
noStroke();
ellipse(0, 0, clockDiameter, clockDiameter);
Add the numerals. Use offsets to visually adjust the positions of the text.
// Write the numerals
fill(255);
textSize(16);
strokeWeight(0.1);

x = cos(PI + HALF_PI) * secondsRadius - 10;
y = sin(PI + HALF_PI) * secondsRadius - 10;
text("XII", x, y);

x = cos(TWO_PI) * secondsRadius + 10;
y = sin(TWO_PI) * secondsRadius + 5;
text("III", x, y)

x = cos(HALF_PI) * secondsRadius - 7;
y = sin(HALF_PI) * secondsRadius + 20;
text("VI", x, y)

x = cos(PI) * secondsRadius - 25;
y = sin(PI) * secondsRadius + 5;
text("IX", x, y)
Here is the complete p5.js code:
function setup() {
  createCanvas(450, 450);
  background(255);
}

function draw() {
  strokeWeight(2);
  translate(width/2, height/2);

  // Drawing the background inside the draw function is necessary
  // to refresh the background so that the hands appear to move
  // on the clock and the previous hands disappear.
  background(255);

  var radius = int(min(width, height) / 2);
  var numPoints = 60;
  var angle = TWO_PI/numPoints;

  var secondsRadius = radius * 0.72;
  var minutesRadius = radius * 0.60;
  var hoursRadius = radius * 0.50;
  var clockDiameter = radius * 1.8;

  // Draw the clock background
  fill(80);
  noStroke();
  ellipse(0, 0, clockDiameter, clockDiameter);

  // subtract HALF_PI to make them start at the top
  var s = map(second(), 0, 60, 0, TWO_PI) - HALF_PI;
  var m = map(minute() + norm(second(), 0, 60), 0, 60, 0, TWO_PI) - HALF_PI;
  var h = map(hour() + norm(minute(), 0, 60), 0, 24, 0, TWO_PI * 2) - HALF_PI;

  //Draw the minute/second ticks
  // beginShape() will build the points into a single custom shape
  strokeWeight(2);
  stroke(255);
  beginShape(POINTS);
  var i = 0;
  while (i < numPoints ) {
      x = cos(angle*i) * secondsRadius;
      y = sin(angle*i) * secondsRadius;
      vertex(x, y);
      i++;
  }
  endShape();

  strokeWeight(1);
  line(0, 0, cos(s) * secondsRadius, sin(s) * secondsRadius);
  strokeWeight(2);
  line(0, 0, cos(m) * minutesRadius, sin(m) * minutesRadius);
  strokeWeight(4);  // hour hand should be thicker
  line(0, 0, cos(h) * hoursRadius, sin(h) * hoursRadius);

  // Write the numerals
  fill(255);
  textSize(16);
  strokeWeight(0.1);

  x = cos(PI + HALF_PI) * secondsRadius - 10;
  y = sin(PI + HALF_PI) * secondsRadius - 10;
  text("XII", x, y);

  x = cos(TWO_PI) * secondsRadius + 10;
  y = sin(TWO_PI) * secondsRadius + 5;
  text("III", x, y);

  x = cos(HALF_PI) * secondsRadius - 7;
  y = sin(HALF_PI) * secondsRadius + 20;
  text("VI", x, y);

  x = cos(PI) * secondsRadius - 25;
  y = sin(PI) * secondsRadius + 5;
  text("IX", x, y);
}
The code in this article is based on this Processing clock example:
https://processing.org/examples/clock.html